

Ready for today’s retirement investing pop quiz?
Does the stock market perform better when inflation is high, low, or somewhere in the middle?
The answer would be important at any time, but especially now that inflation has started to heat up. The Consumer Price Index’s 12-month rate of change stood at just 0.2% in May of last year, for example, and has jumped since then to 2.6%. And this rate of change is likely to jump even more when the CPI level for April is released on May 12.
The conventional narrative is that higher inflation creates strong headwinds for stocks, and this narrative is certainly plausible. The present value of future earnings and dividends goes down as inflation rises, so other things being equal you’d expect higher inflation to translate into lower stock prices.
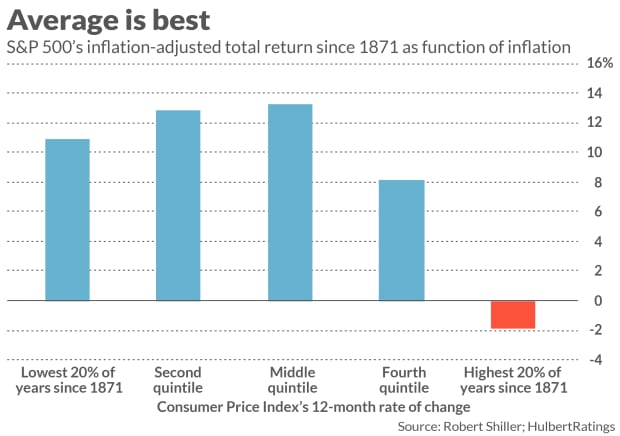
But U.S. history does not provide as strong a support for this narrative as you might think, as you can see from the accompanying chart. It shows the stock market’s average yearly inflation-adjusted total return since 1871 as a function of the CPI’s trailing 12-month rate of change. The stock market’s best average performance was produced when inflation was in the middle of the distribution.
The CPI’s 12-month rates of change that fall into this middle quintile range from 1.5% to 3.0%. That’s right where we are now.
What if the CPI’s 12-month rate of change rises even higher than 3% in coming months, as some are forecasting? That is unlikely in and of itself to sabotage the stock market, for two reasons. The first is that the stock market’s average return in the next higher quintile, while lower than in the first, second and third quintiles, is nevertheless not significantly different than the all-quintile average.
The second reason a jump in inflation above 3% is unlikely to sabotage the stock market: Any such jump is likely to be temporary, caused by comparison values from a year ago that were artificially depressed by the pandemic. According to an inflation model constructed by the Federal Reserve Bank of Cleveland, expected inflation will average 1.46% over the coming five years and 1.57% over the coming decade. Those are all solidly in the middle quintile of the historical distribution of the CPI’s 12-month rates of change.
Other estimates of inflation are somewhat higher than the Cleveland Fed’s, but still within this middle quintile. Consider the 5-year breakeven inflation rate, which is the difference between the yield on the nominal 5-year Treasury and that of the 5-year TIPS. This currently stands at 2.5%. The 10-year breakeven rate is slightly lower at 2.4%.
These estimates certainly can be wrong, of course. But it’s not easy to dismiss them, either. The breakeven inflation rates, for example, represent the collective wisdom of bond traders worldwide, who have invested trillions in the Treasury market and who move huge sums in and out of various Treasuries on a change in expected return of just a few basis points.
What’s the inflation sweet spot for bonds?
Retirees and near-retirees are also very interested in inflation’s impact on bonds, since an outsized portion of their portfolios is likely invested in fixed income. So I was curious whether bonds’ inflation sweet spot is the same as for stocks.
It’s not, though this is hardly surprising, since bonds do best when interest rates are lowest. And interest rates are closely correlated with inflation.
| Quintile of distribution since 1871 | Range for CPI’s 12-month rate of change | Bonds’ average inflation-adjusted total return since 1871 |
| Lowest | Below minus 0.5% | 10.9% |
| Second | Between minus 0.5% and plus 1.5% | 3.7% |
| Middle | Between 1.5% and 3% | 3.3% |
| Fourth | Between 3% and 5.3% | 3.4% |
| Highest | Above 5.3% | Minus 6.1% |
Notice from the accompanying table, however, that bonds’ average inflation-adjusted total return is quite similar across the three middle quintiles of the distribution. That covers 60% of the time, of course.
To be sure, within each quintile there still is a wide range of returns. So even though we’re in the middle quintile of the historical distribution of the CPI’s 12-month rate of change, bonds could still produce a return well below the average reported in the table.
Nevertheless, history’s overall message for both stock and bond investors is that moderately higher inflation need not be disastrous—and might even be a good thing.
Mark Hulbert is a regular contributor to MarketWatch. His Hulbert Ratings tracks investment newsletters that pay a flat fee to be audited. He can be reached at mark@hulbertratings.com
"spot" - Google News
May 01, 2021 at 01:15AM
https://ift.tt/3e3Wl1k
The inflation 'sweet spot' - MarketWatch
"spot" - Google News
https://ift.tt/2sMidK2
https://ift.tt/3c9XpgI
Bagikan Berita Ini


0 Response to "The inflation 'sweet spot' - MarketWatch"
Post a Comment